Reading the Wind Profile Plot |
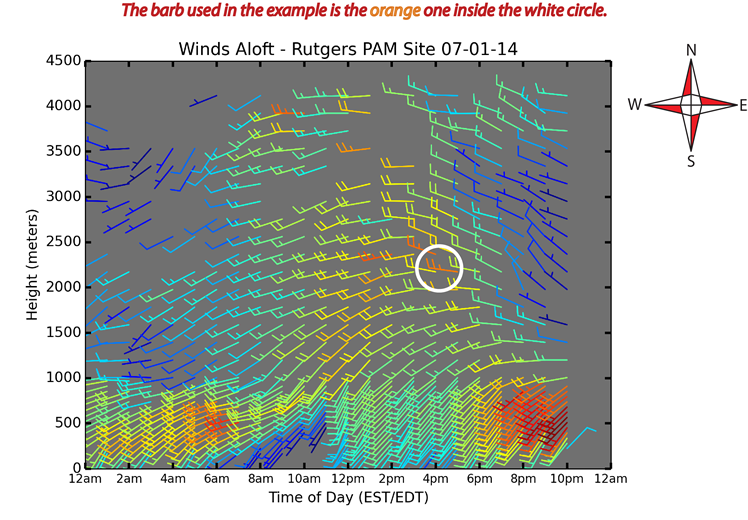
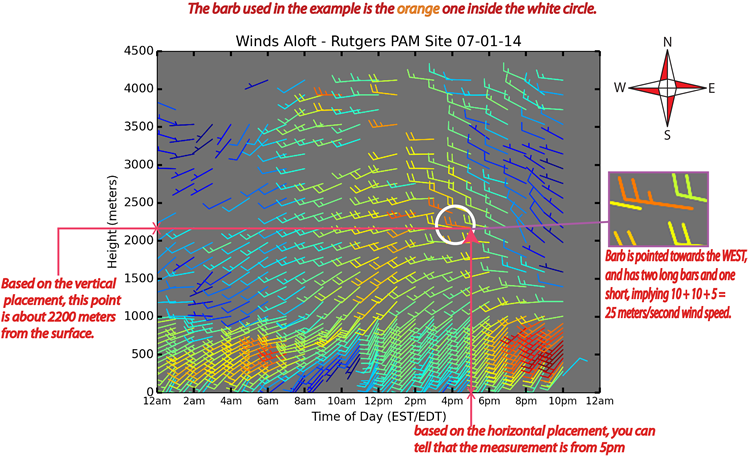
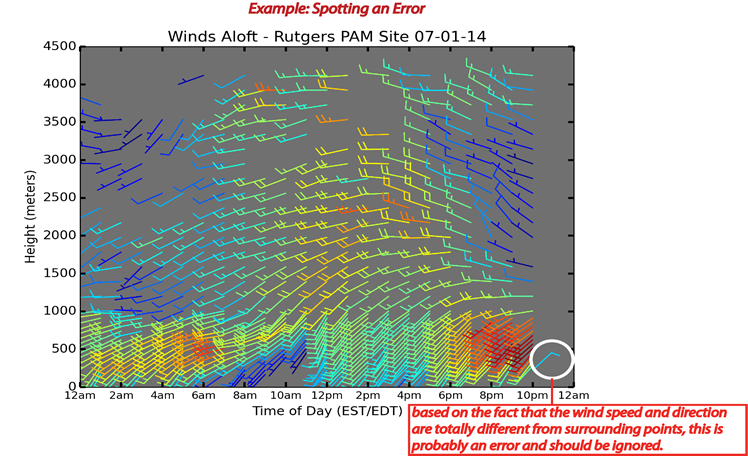
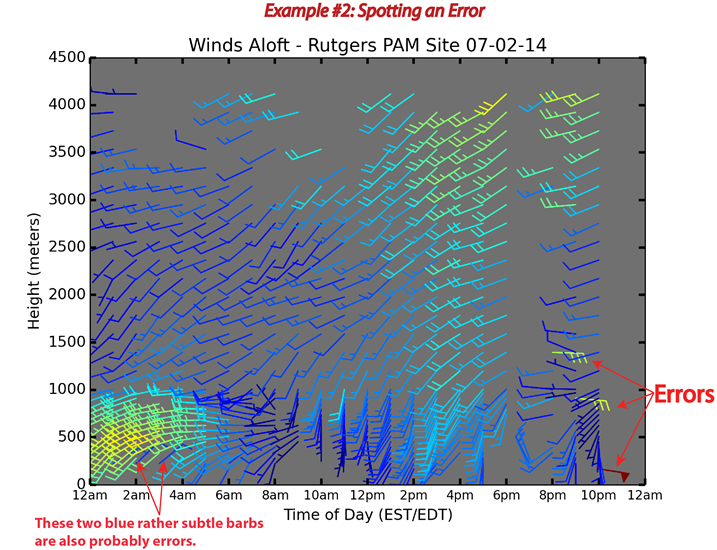
The wind profile plot shows hourly wind speed and direction at different levels in the atmosphere from ground-level up to around 4500 meters (~14,500 ft., or 2-3 miles) into the sky. There are many important pieces of information that can be gathered from this data, including evaluating temperature inversions, as well as watching different frontal features as they pass through the atmosphere above.
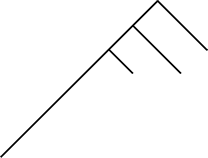
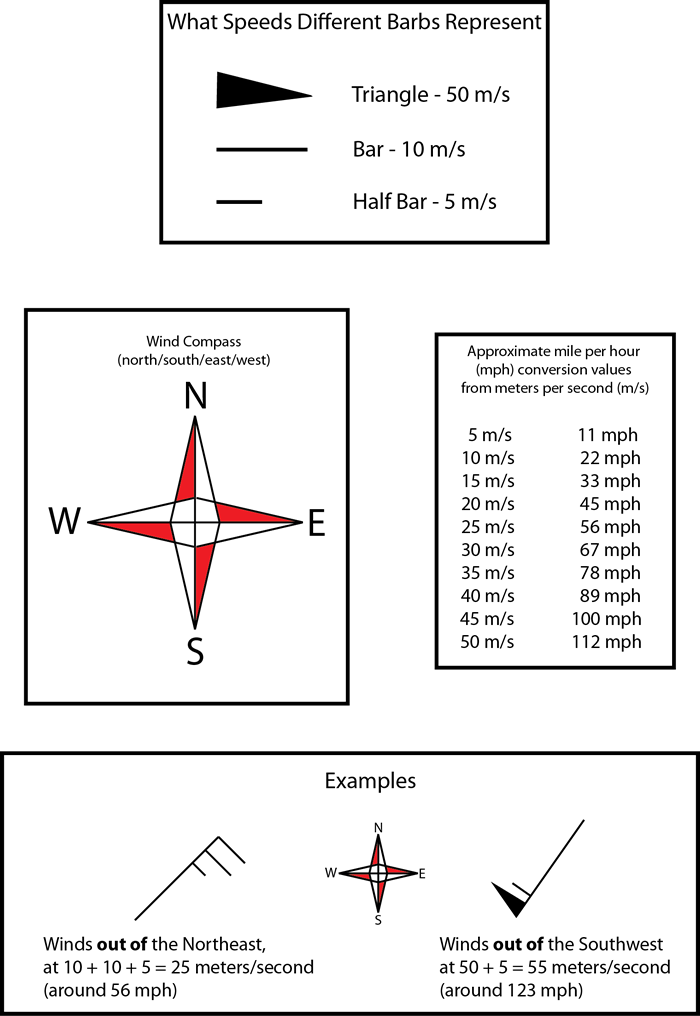
What is a wind barb?Each data point on the graph is represented by a wind barb. Wind barbs are a standard method of showing wind speed and direction in the atmosphere used by meteorologists all over the world.
How do you read wind barbs?
The direction that a barb points indicates the direction that the wind is coming from based on a standard compass, with north point straight up. Different lines and shapes, called flags, that appear on the end of the barb represent the speed of the wind. A brief illustrated overview:
Colors on the barbs are just an added way of distinguishing wind speeds. Cooler colors such as blues, purples, and greens, are slower winds, and warmer colors such as reds, and oranges are faster winds.
How do I then read the wind profile graph?
Easy! Let's pick a random point on a random graph:
Using that example barb...
Therefore, our sample barb represents the winds 2200 meters above the surface at 5pm, with an average wind speed of 25 meters per second blowing from the west.
Is there a chance there might be errors on this graph?
|